Our sequence alignment engine includes an option for handling barcodes (also called "UMI" or "Index") in experimental templates, and for detecting barcode amplification bias.
Here's a typical barcode analysis scatterplot:
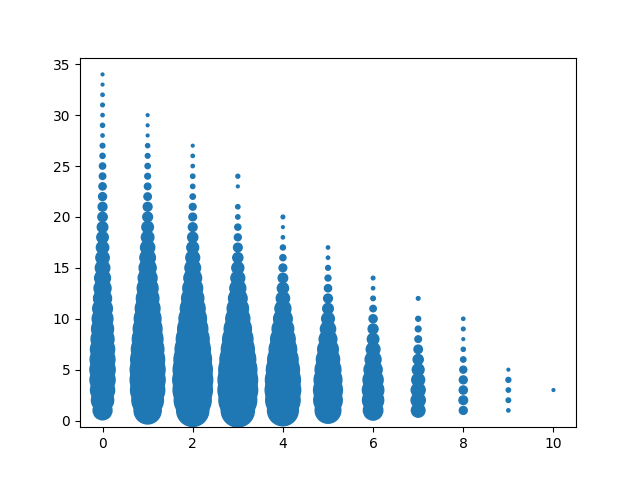
The y-axis is "barcode multiplicity" -- that is, for a given barcode, how many times does it appear in this sample. The x-axis is the number of "C" nucleotides in the barcode -- barcodes are length 10, so the axis is from zero to 10. The size of the dot indicates the number of barcodes that match the parameters. So, for example, the lone dot in the upper-right indicates that there is one barcode of multiplicty 35, and it doesn't have any C nucleotides. The very wide dots just above the "2" x-axis marker indicate that there are a lot of barcodes with two C's that have multiplicity from 1 to 10.
Now, take a look at a similar plot, this time with the x-axis indicating the number of A or T nucleotides in the barcode:
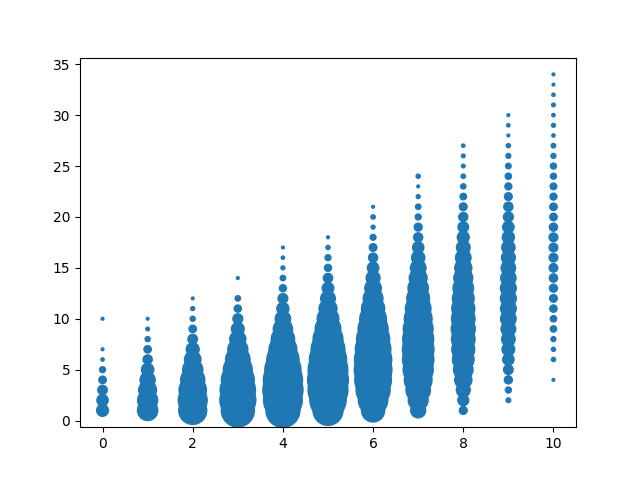
As you can immediately see from the plot, there is a clear positive correlation between barcode multiplicity and the number of A/T nucleotides. This indicates that this particular experiment had an amplification bias towards A/T-heavy barcodes.
Our experimental alignment tool automatically checks for and flags any kind of barcode amplification bias, and generates these plots (along with underlying CSV data) for visual confirmation.